 Building dashboards for your nonprofit is like baking a cake – you must have the right ingredients. But even the right ingredients can make a terrible cake if they aren’t combined in the right proportions.
A nonprofit dashboard varies according to the users’ needs. Some users need a deeper look into an organization’s finances. For them, the “ingredients” draw more from the accounting and financial side of the software than other data. For others, the final “cake” has to be shared with people outside of the organization, so the presentation is everything. Here’s how to make the ultimate nonprofit dashboard.
How to Build a Dashboard
There are many ways in which you can build a nonprofit dashboard to tell your story. Consider the strategic, tactical, and operational needs for the data.
• Strategic data usage provides comparative metrics or KPIs. You may wish to display clients served, revenue trends, performance comparisons, and progress towards achieving KPIs.
• Tactical use may provide decision-making information including data on specific programs, grants, and activities.
• Operational data provides a detailed picture of daily activities to manage the organization, including budgets, services, and employee information.
Another important consideration is the “ingredients” you have on hand to build out a dashboard. You may need to ask if your ERP, accounting, or fundraising/CRM systems can build out dashboards, for example.
Next, ask yourself why you need the information. Are you more likely to be providing a report to senior management or creating board presentations? Perhaps you need the information on a daily basis to make important decisions pertaining to your job. In that case, you may want to look at building dashboards with a more tactical use.
Lastly, consider the potential output formats you may need. If you frequently need to run the dashboard reports and output them to email to others, you may need the ability to print to PDF. Others may need to export graphs to place into presentations.
Examples of Role-Based Dashboards
Let’s look at a few examples of customized dashboards for nonprofits.
Program Manager
Jack is a program manager at a nonprofit. He needs to know both the financial data from the programs that he manages as well as the customer or client-related data. He reviews the possible inputs and chooses the following for his customized dashboard:
1. Profit and loss by program
2. Budget to actual by program
3. Clients served/enrollment
4. Cost per client
5. Time to serve client
6. Client demographics – gender, ethnicity, age, etc.
7. Staff levels by client
This is a complex group of information needed for Jack’s dashboard. The information can be grouped and analyzed to produce the needed visualizations. Jack can now see at a glance how profitable each program is for his organization, as well as how well they are serving the needs of their clients.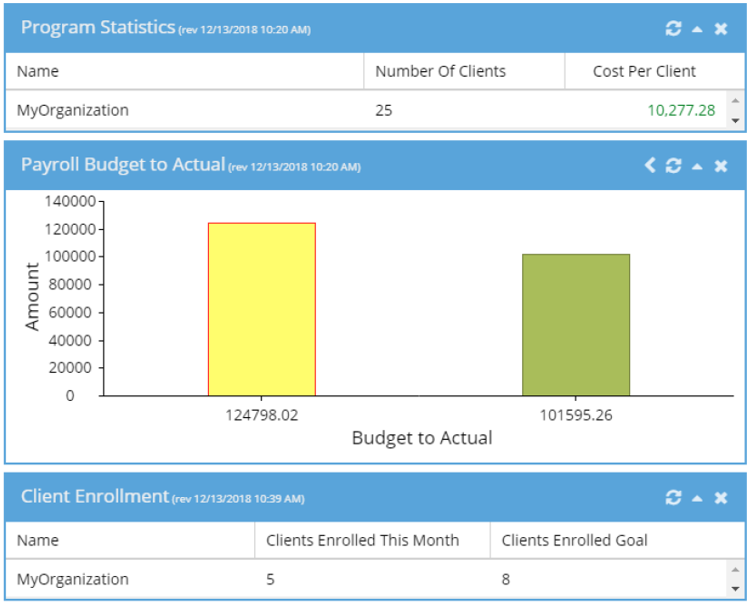
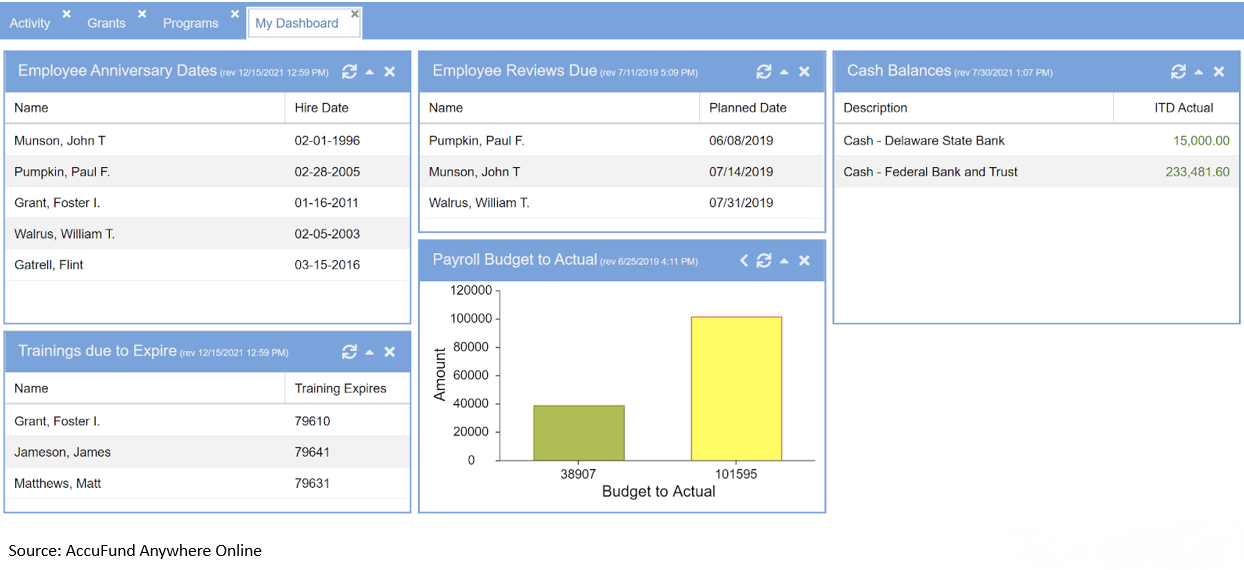
Board of Directors
Board reports and dashboards deliver a variety of information to the governing team, enabling them to receive a full picture of your organization. providing leadership and vision to your nonprofit. They rely on a full breadth of data, in a variety of formats.
1. Liquidity metrics [LUNA (Liquid Unrestricted Net Assets), various liquidity ratio analysis, organizational reserves, operational surplus trends, etc.]
2. Overall budget to actual
3. Performance comparisons (revenue, personnel, receivables, outcomes/deliverables, etc.)
4. Outlier program information.
5. Metrics unique to their organization – demographic information
6. Challenges unique to their organization
Often these dashboards are more difficult to produce because they might require more analysis and nuances beyond what most systems can provide. Often these metrics change based on the concerns of the board and the challenges the organization faces. These are likely more of a presentation format and often require some dashboard software to create visually nuanced images.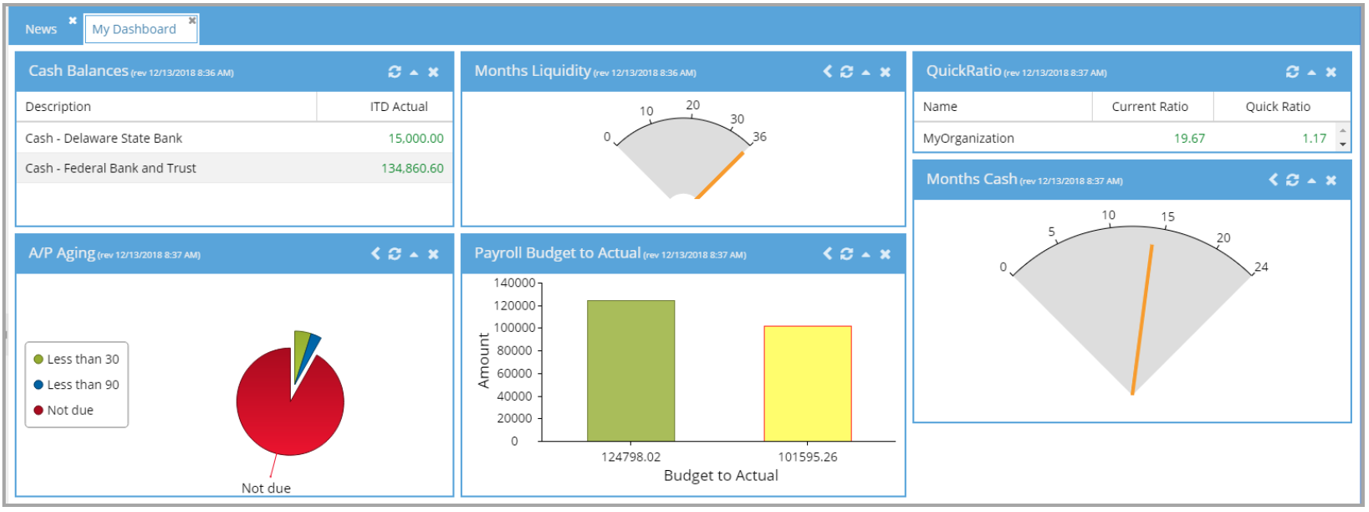
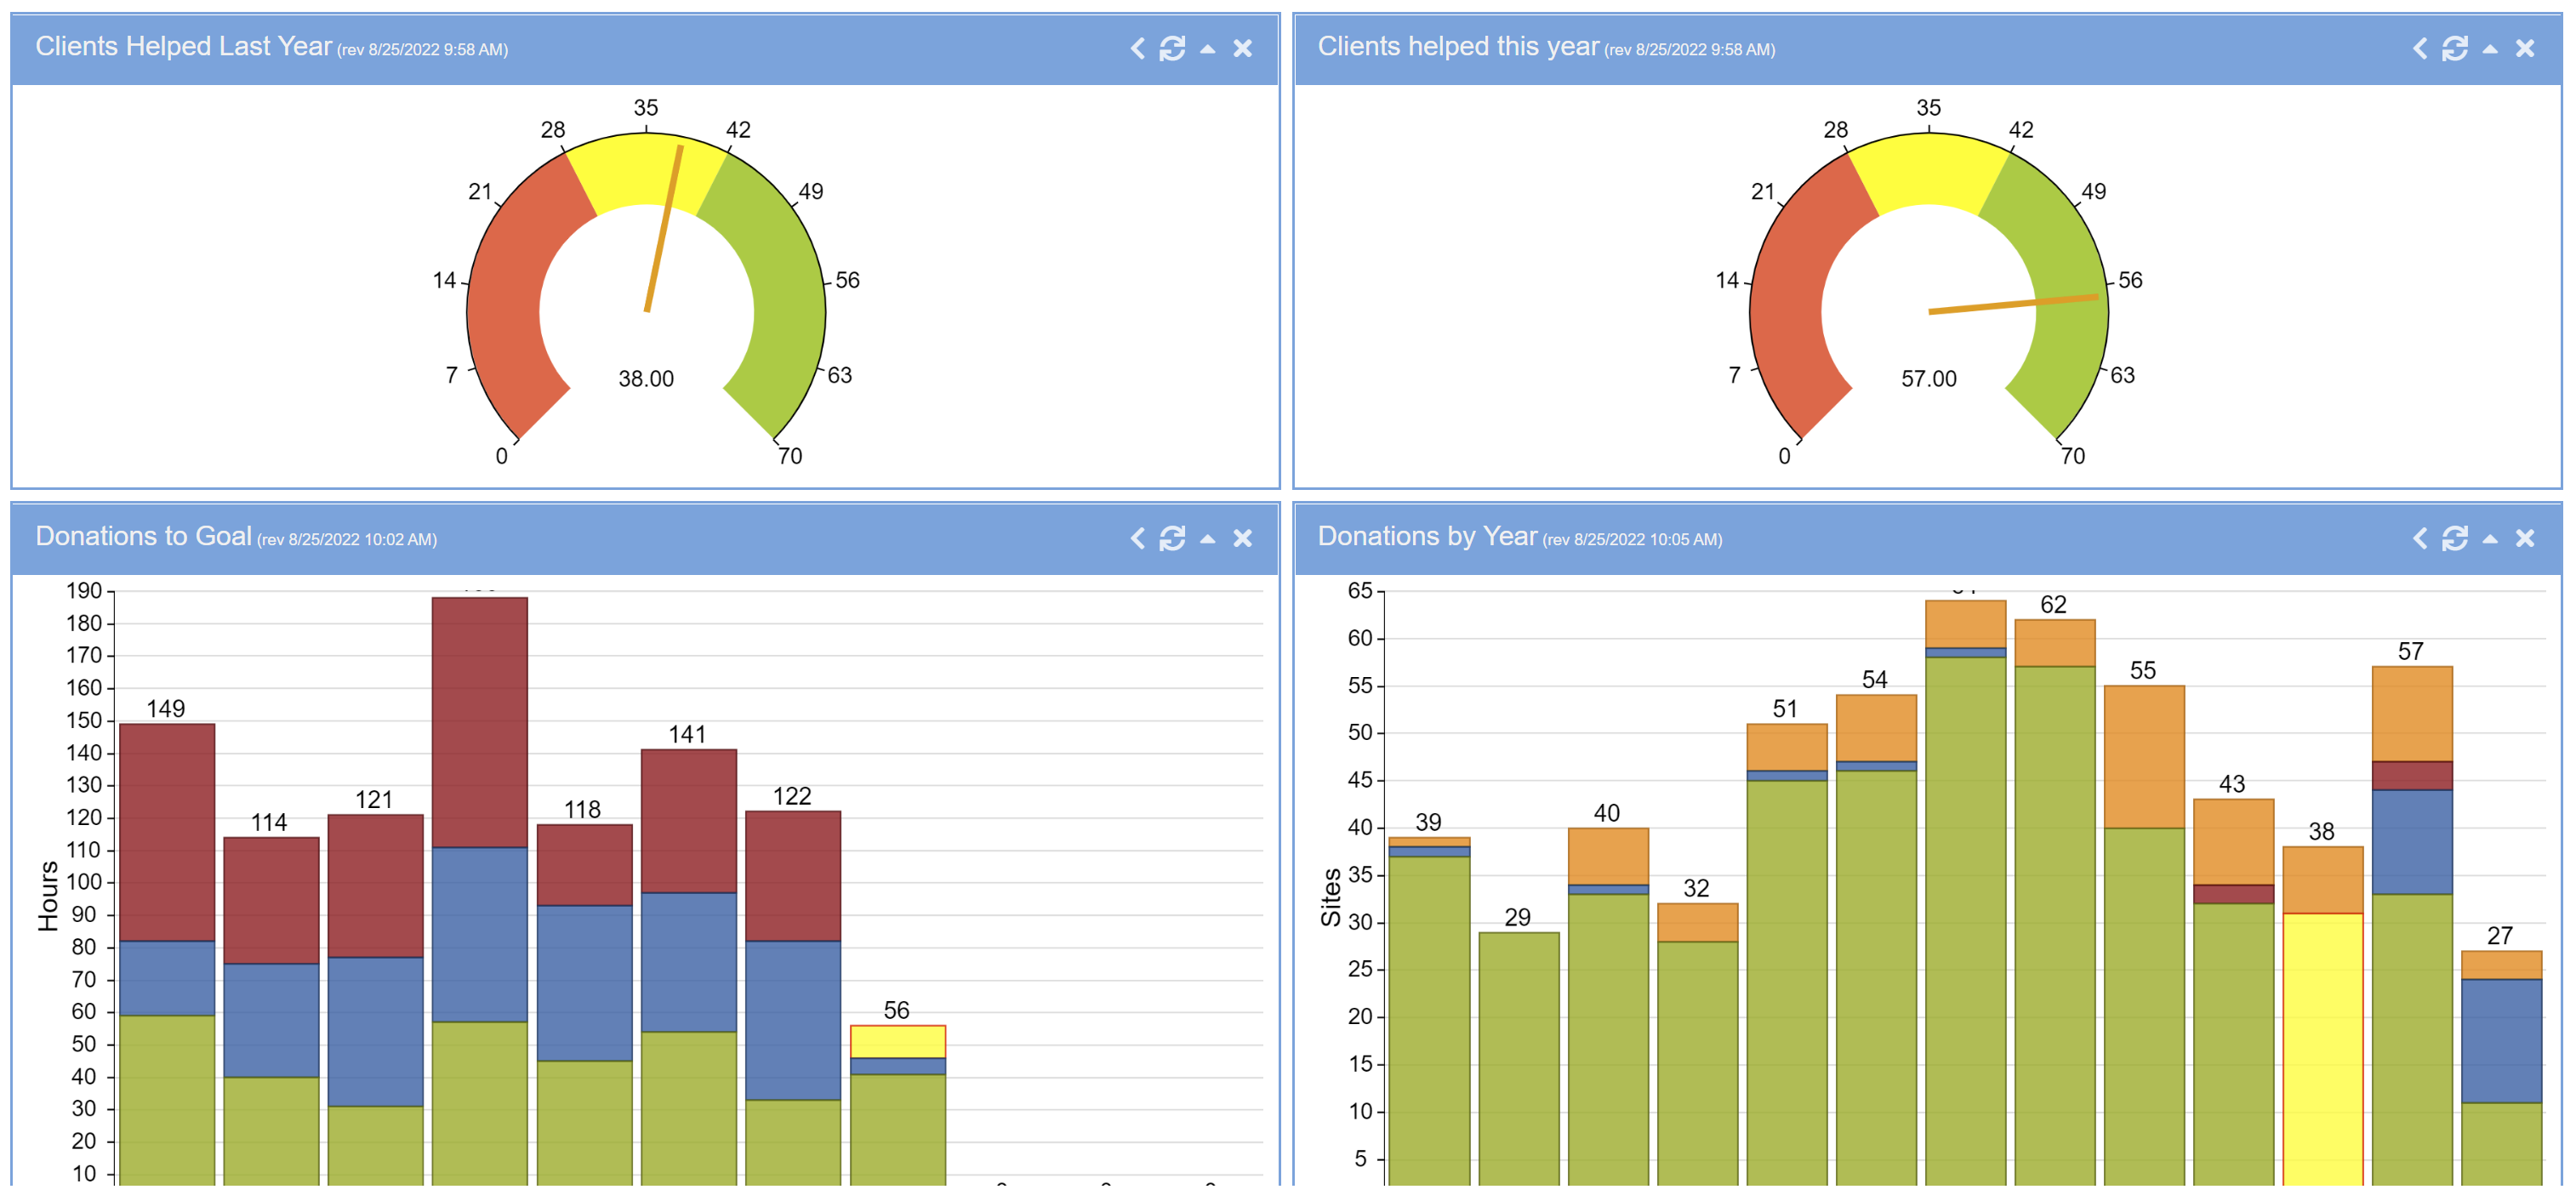
Fundraising Director
A fundraising director’s job involves a combination of marketing and finance with a sprinkle of operations. Here’s how it might look when putting together this customized dashboard.
Samantha is the director of fundraising for a nonprofit. She’s customizing her information dashboard. As she reviews the available inputs, she decides to add:
1. Revenue by source
2. Progress to fundraising goal
3. Individual giving (restricted vs. unrestricted)
4. Board giving
5. Donors and an annual comparison of donors from year-to-year
6. Fundraising event comparison
7. Annual fundraising forecast
8. KPIs for her department
This information is now contained in various data visualizations on her dashboard. She can assess fundraising revenues by source and the progress towards goals, as well as monthly vs. annual progress. Such information is invaluable as Samantha makes decisions throughout her busy workday.
Are You Ready to Really Use Your Data?
As you can see creating customed dashboards takes existing data streams, combines, and analyzes them, and outputs them in ways you can use quickly and easily.
Selecting just the data that you need to view and use ensures that data overwhelm doesn’t keep you from receiving what you need to do your job effectively. Having customizable dashboards goes a long, long way towards ensuring productive, effective use of data, and to helping all members of the team make timely, informed decisions.
About AccuFund - AccuFund Dashboards Go the Extra Mile
AccuFund and its customizable dashboard feature puts accurate, timely data visualizations at everyone’s fingertips. AccuFund nonprofit accounting software is available online or onsite. AccuFund dashboards can handle complex data interactions, for example, such as calculating both financial and performance ratios. The system can calculate and depict items such as days cash on hand, current ratio, and liquid unrestricted net assets (LUNA), all information that is not readily available on competing software products.
To get the most from your AccuFund dashboard, you can build it the way you need to use it. Like building anything – a house, a sandwich, a cake – you first need to take stock of what you have on hand. Having the right ingredients in place makes the process easier.
Related Materials
Dashboard Dynamics. Creating & Perfecting Insightful Nonprofit Dashboards. On-Demand Webinar
Dashboards for Nonprofits White Paper